Large-scale network motif analysis using compression
Published jointly at ECMLPKDD 2020 and in Data Mining and Knowledge Discovery together withGraphs, or networks, are a powerful and versatile way of capturing knowledge. The downside to all this power is that when we’ve collected all our data into a large graph, and we want to have a look at it, we are usually faced with something like this
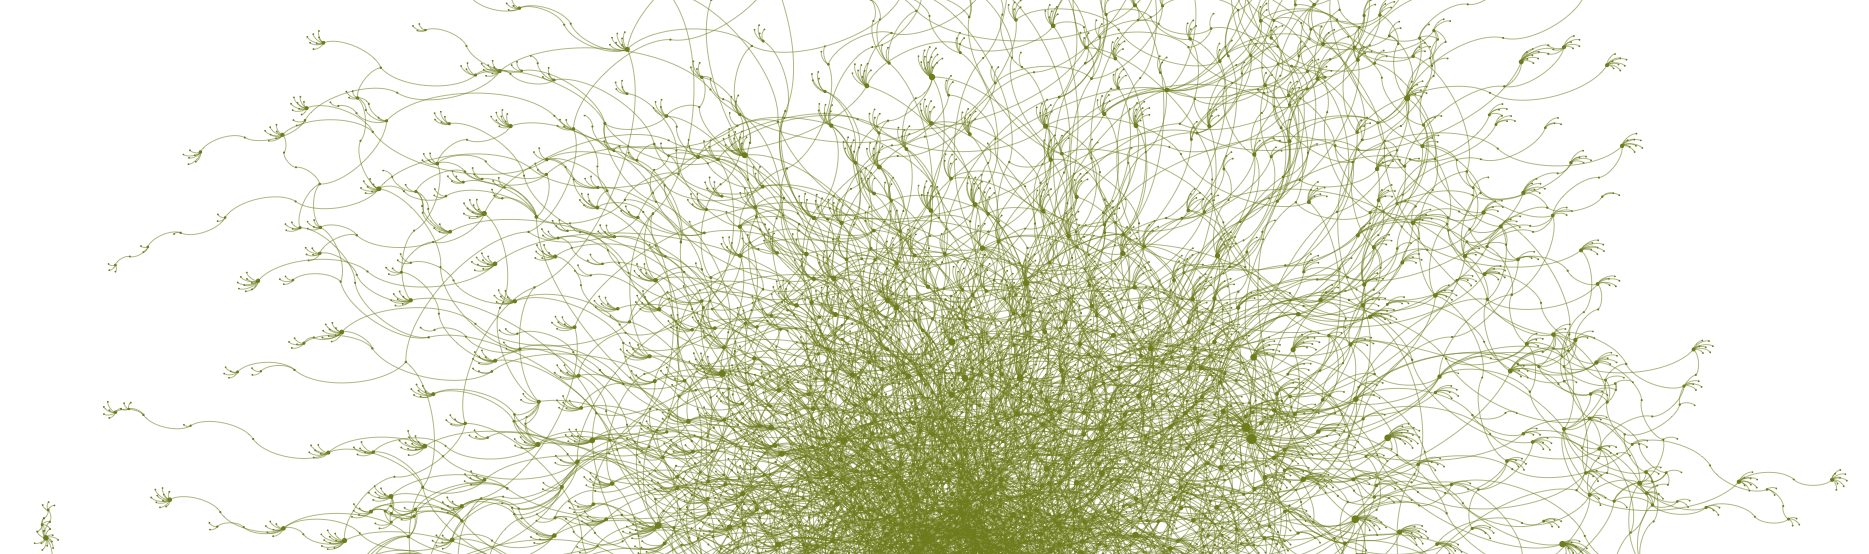
This looks impressive, but it doesn’t really tell us very much. How can we learn more about the structure of a large graph once we’ve collected it?
One way is to look for building blocks: small subgraphs that occur often in the graph, and wherever they occur, tend to play the same role. This is know as motif analysis.
Now you might think that this is easy: just figure out which subgraphs occur often. To explain why that isn’t enough, imagine that you are given a book of english language text. and you are trying to understand its structure. Simply extracting the most frequent words will just get you words like the, be, to and so on. These may be useful, but they aren’t very particular to this book.
To find the building blocks that are particularly frequent for this book, we need a null model. In particular, we need a probability distribution that tells us, for each word, what the probability is that we encounter it with a particular frequency in any English of of the same length as ours. Something like this

Using this distribution, we can look up what the probability is that a word, in this case the word species, occurs at least as frequently as we’ve seen it occur. We might say something like: _If the probability of seeing the word “species” (at least) this often is less than 0.05 in a normal English book, it must be a very characteristic word for this book.

Applying the same logic to graphs, we may end up with something like this

We define a null model that determines which frequencies we expect to see in a graph, and any subgraph that appear unexpectedly frequently, is likely to be characteristic for the graph. Or, in other words, it is a motif.
The problem is that this last image is very expensive to compute. Given a probability distribution on graphs, there isn’t usually an analytical way of working out which frequency have which probability for a given subgraph. Instead, the best we can do is usually to sample a large number of graphs and count how often the subgraph appears in each, building up a histogram approximation of the distribution we’re after. Since both the sampling and the counting are very expensive operations on large graphs, this puts a fundamental limit on how large the graph can be.
In our paper, we propose a radically different approach: instead of counting frequencies, we use the subgraph to compress the data. The null model in our setting is a baseline compressor. If the subgraph-based compressor does better than the baseline by a sufficient number of bits, we consider the subgraph a motif.
This may sound like such a radical departure from the traditional method that the two are hardly comparable, but it turns out that if we formalize it properly, both the traditional method and the compression-based method can be cast in the framework of null-hypothesis significance testing. Allowing us to make a very detailed comparison between the two methods.
In the end, our method is particularly suitable for large graphs. We show that we can perform a motif analysis on a graph with billions of edges in under 9 hours, on a single compute node. We show experimentally that the motifs returned by our method are of comparable quality to those returned by the traditional method, thus allowing a whole new regime of graphs to be analyzed by motif analysis.